If, like me, you have a lot of legacy systems which are reliant on Abode Flash for their management UIs (eg vSphere Client) then Flash being killed off is very inconvenient
Luckily there is currently a fix!
This works as of January 12th 2021, who knows if it will be killed off.
This requires the creation of a file in the data directory of your browser
Google Chrome
To enable Flash in Chrome you need to create a file and provide it with some custom config.
Browse to your user’s local appdata directory ( %localappdata% can be used if it’s configured)
Within in browse to \Google\Chrome\User Data\Default\Pepper Data\Shockwave Flash\
Create a new Folder called “System” and within here create a new file called mms.cfg
edit this file in notepad (other text editing programs are available) and enter the following text:
I have a client using vROps 7 quite extensively, however they were still running a manual API Query to create a report on how many VMs of a certain size they could fit into their estate based on Allocation, which of course has been removed in 6.7 and 7.0. Running API Queries across their whole estate is a slow process, so they are interested in using vROps to estimate remaining VM overhead on a cluster.
Luckily this can be solved with a Super Metric.
First we need to calculate how many vCPU are available in total in the cluster, which is determined by the total number of cores multiplied by the overallocation ratio (4:1 here) and removing a buffer, in this case we are using 20% (80% remaining), but this can be set as the core count of one host if you prefer.
Then we remove the number of vCPUs that have been allocated to all the VMs.
Finally we divide by the number of vCPUs our template VM has. Two in this case.
Next we need to determine the available RAM in total in the cluster, which is determined by the total RAM minus a buffer, again this can be equivalent to one host if prefered.
We then need to remove the RAM allocated to all the VMs.
Next we need to then divide this value by 1048576 to convert from KB to GB
And then we divide by the number of GB of RAM our VM has. We are using 4GB here.
For our last calculation, we need to determine the Storage by taking the total storage capacity, removing our buffer and removing the total usage. You could also use the total allocated if you don’t want to over provision storage. If you are using vSAN you can add in the vSAN replica storage as well. 2x for RAID1, 1.33x for Erasure Coding FTT=1 (AKA RAID5) and 1.5x for Erasure Coding FTT=2 (AKA RAID6). We are using RAID5 in this example.
We then divide this by either the size of the VMDK HDD or an average utilisation depending on your policy. We are using 80GB here for calculation purposes.
Now we have our three calculations we need to use some advanced Super Metric functions to chose the calculation with the lowest number, as that will be the driving factor on what will fit in the cluster.
This is done with the function “MIN” and feeding in an array
min([FormulaA,FormulaB,FormulaC])
Now we have the minimum number of VMs which will fit, we need to round down that number, because nobody cares that 67.432 VMs could fit in the cluster, they want to know that 67 VMs will fit. Luckily there is another function for that – “FLOOR”. This is similar to ROUNDDOWN in that it give you the whole value.
floor(formula)
FYI “CEIL” is equivalent to ROUNDUP if you want the value to be rounded up.
Now we tie these all together to get our full calculation.
Now clone this to estimate remaining VM Overhead for each T-Shirt size you offer.
Update March 2020
I have further updated this super metric to use total provisioned for the storage when in use with vSAN or other thin provisioned datastores as well as also taking Swap size into account, and changed the overhead from a flat 20% to the equivalent of two hosts.
This section will take the total core count, and then remove the total core count divided by the number of hosts and multiply by the number of host failures to allow in a cluster (2 in this case), and then multiply by the vCPU to Core overallocation ratio (4:1 in this case).
For storage I have changed to using the metric “diskspace|total_provisioned” instead of “diskspace|total_used” and added the memory size on top of the HDD size (500GB HDD plus 32GB Swap)
I had a requirement from a customer to identify log events in order to create alerts for several threat scenarios. This post is intended to provide a high-level description of the results for the scenarios for future reference or in case anyone finds a use. Please see the earlier post on enabling additional vCenter and PSC logging. http://www.caenotech.co.uk/vmware/configuration-of-rsyslog-on-vcsa-and-psc/
Access to vCenter Administrator role
The objective of the following is to ensure nobody other than certain colleagues have access to the Cryptography operations within vCenter and that all work carried out on crypto operations is done under suitable change control.
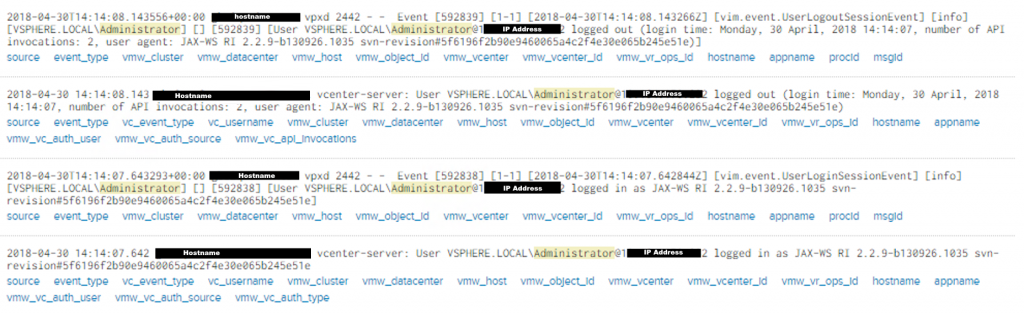
As can be seen the default syslog details the Administrator user logging in as VSPHERE.LOCAL\Administrator and the IP it has originated from
<datetime> <vCenterHostname> vcenter-server: User <Domain>\<Username>@<IPAddress> logged in as JAX-WS RI 2.2.9-b130926.1035 svn-revisions#<UID>

<datetime> <vCenterHostname> vpxd <eventID> - - Event [<LineID>] [1-1] [<datetime>] [vim.event.UserLoginSessionEvent] [info] [<Domain>\<Username>] [] [LineID] [User <Domain>\<Username>@<IPAddress> logged in as JAX-WS RI 2.2.9-b130926.1035 svn-revisions#<UID>]

<datetime> <vCenterHostname> vcenter-server: User <Domain>\<Username>@<IPAddress> logged out (login time: <datetime>, number of API invocations: <x>, user agent: JAX-WS RI 2.2.9-b130926.1035 svn-revisions#<UID>)

<datetime> <vCenterHostname> vpxd <eventID> - - Event [<LineID>] [1-1] [<datetime>] [vim.event.UserLoginSessionEvent] [info] [<Domain>\<Username>] [] [LineID] [User <Domain>\<Username>@<IPAddress> logged out (login time: <datetime>, number of API invocations: <x>, user agent: JAX-WS RI 2.2.9-b130926.1035 svn-revisions#<UID>)]
the text strings “vim.event.UserLoginSessionEvent” and “vim.event.UserLogoutSessionEvent” can be used to alert on people logging into the vCenter
Alteration of vCenter Roles
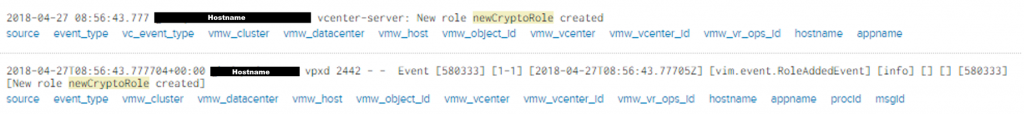
Creation of a new vCenter role “newCryptoRole”
From the default log we can show that the new role is created however does not show whom by or which permissions it is given.
<datetime> <vCenterHostname> vcenter-server: New role <roleName> created

<datetime> <vCenterHostname> vpxd <eventID> - - Event [<LineID>] [1-1] [<datetime>] [vim.event.RoleAddedEvent] [info] [] [] [LineID] [New role <roleName> created]
This is where the additional vpxd-svcs log is required for details of who completed the action and what permissions were assigned to the role
[tomcat-exec-176 INFO AuthorizationService.AuditLog opId=] Action performed by principal(name=VSPHERE.LOCAL\Administrator,isGroup=false):Add role Id=-922973018,Name=newCryptoRole,Description=,Tenant=Privileges=[System.Anonymous, System.Read, System.View, Cryptographer.Clone, Cryptographer.Encrypt, Cryptographer.Migrate, Cryptographer.RegisterVM, Cryptographer.ManageKeyServers, Cryptographer.Decrypt, Cryptographer.AddDisk, Cryptographer.ManageKeys, Cryptographer.ManageEncryptionPolicy, Cryptographer.Access, Cryptographer.Recrypt, Cryptographer.RegisterHost, Cryptographer.EncryptNew]
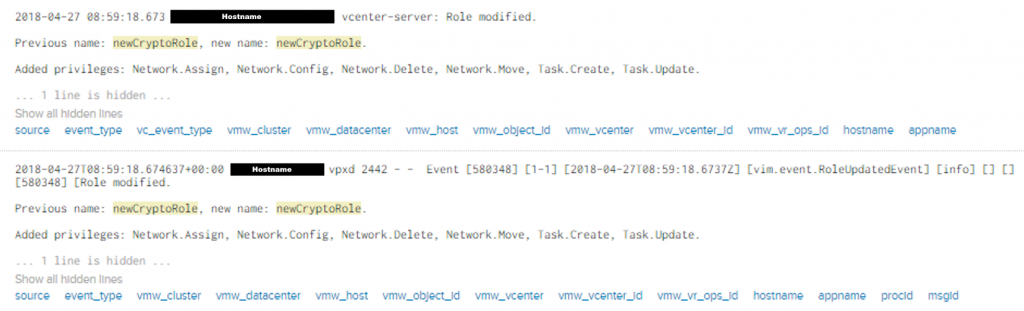
Modification of permissions to any vCenter role
<datetime> <vCenterHostname> vcenter-server: Role modified
Previous name: <roleName>, new name <newRoleName>
Added privileges: <privilegesAdded>
Removed privileges: <privilegesRemoved>

<datetime> <vCenterHostname> vpxd <eventID> - - Event [<LineID>] [1-1] [<datetime>] [vim.event.RoleUpdatedEvent] [info] [] [] [LineID] [Role modified
Previous name: <roleName>, new name <newRoleName>
Added privileges: <privilegesAdded>
Removed privileges: <privilegesRemoved>]
From the default log we can show that the role is modified and which permissions have been added, however does not show whom by. This is where the additional vpxd-svcs log is required for details of who completed the action
[tomcat-exec-17 INFO AuthorizationService.AuditLog opId=a794037d-a725-4b89-ab96-d3a23a58648c] Action performed by principal(name=VSPHERE.LOCAL\Administrator,isGroup=false):Update role Id=-922973018,Name=newCryptoRole,Description=,Tenant=Privileges=[System.Anonymous, Cryptographer.Clone, Cryptographer.Encrypt, Cryptographer.Migrate, Cryptographer.RegisterVM, Cryptographer.ManageKeyServers, Cryptographer.Decrypt, Cryptographer.AddDisk, Cryptographer.ManageKeys, Cryptographer.ManageEncryptionPolicy, System.View, Cryptographer.Access, Cryptographer.Recrypt, Cryptographer.RegisterHost, System.Read, Cryptographer.EncryptNew, Network.Assign, Network.Config, Network.Move, Network.Delete, Task.Create, Task.Update]
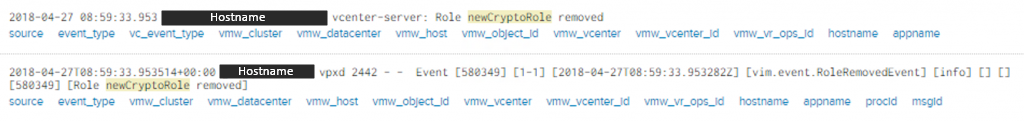
From the default log we can show that the role is removed, however does not show whom by. This is where the additional vpxd-svcs log is required for details of who completed the action
[tomcat-exec-2 INFO AuthorizationService.AuditLog opId=c0100be8-9114-4e60-9520-4cf1b6015793] Action performed by principal(name=VSPHERE.LOCAL\Administrator,isGroup=false):Delete role -922973018
Assignment of User to a Role
Assigning a user to a role is not recorded in the default logs, this requires the additional vpxd-svcs log
[tomcat-exec-232 INFO AuthorizationService.AuditLog opId=] Action performed by principal(name=VSPHERE.LOCAL\Administrator,isGroup=false):Added access control [ Principal=Name=VSPHERE.LOCAL\newCryptoUser,isGroup=false,roles=[-922973018],propogating=true ] to document urn:acl:global:permissions
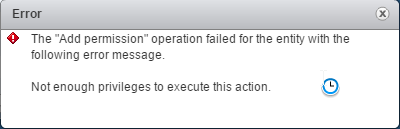
If you attempt to assign a user to a role with higher permissions that your current user you will receive the following error message in the vCenter Web UI
Additionally the following event is recorded in the vpxd-svcs.log
[tomcat-exec-293 WARN com.vmware.cis.authorization.impl.AclPrivilegeValidator opId=] User VSPHERE.LOCAL\newUser does not have privileges [System.Anonymous, Cryptographer.Clone, Cryptographer.Encrypt, Cryptographer.Migrate, Cryptographer.RegisterVM, Cryptographer.ManageKeyServers, Cryptographer.Decrypt, Cryptographer.AddDisk, Cryptographer.ManageKeys, Cryptographer.ManageEncryptionPolicy, System.View, Cryptographer.Access, Cryptographer.Recrypt, Cryptographer.RegisterHost, Authorization.ModifyPermissions, System.Read, Cryptographer.EncryptNew] on object urn%3Aacl%3Aglobal%3Apermissions
Adding user to Platform Services Controller SSO Groups
In order to capture logs showing adding user to the “SystemConfiguration.BashShellAdministrators” group we require the additional logs ssoAdminServer.log and vmdir-syslog.log
./sso/ssoAdminServer.log:
pool-4-thread-1 opId=73c87e6b-746c-46f2-9b59-a5da95f5a1c1 INFO com.vmware.identity.admin.vlsi.PrincipalManagementServiceImpl] [User {Name: Administrator, Domain: vsphere.local} with role 'Administrator'] Adding users to local group 'SystemConfiguration.BashShellAdministrators'
./vmdird/vmdird-syslog.log:
info vmdird t@139993972463360: MOD 1,add,member: (CN=Administrator,CN=Users,DC=vsphere,DC=local) info vmdird t@139993972463360: Modify Entry (CN=SystemConfiguration.BashShellAdministrators,DC=vsphere,DC=local)(from 127.0.0.1)(by <PSCName>@vsphere.local)(via Ext)(USN 4974)
Cryptographic Components
The objective of these alerts are to ensure that vSAN encryption is not disabled (where enabled) or enabled (where it’s not). Equally, any tampering with KMS (required for encryption) should be correlated back to change control / incident management.
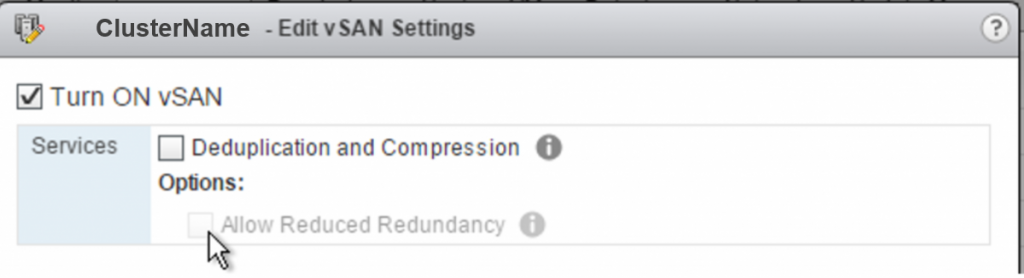
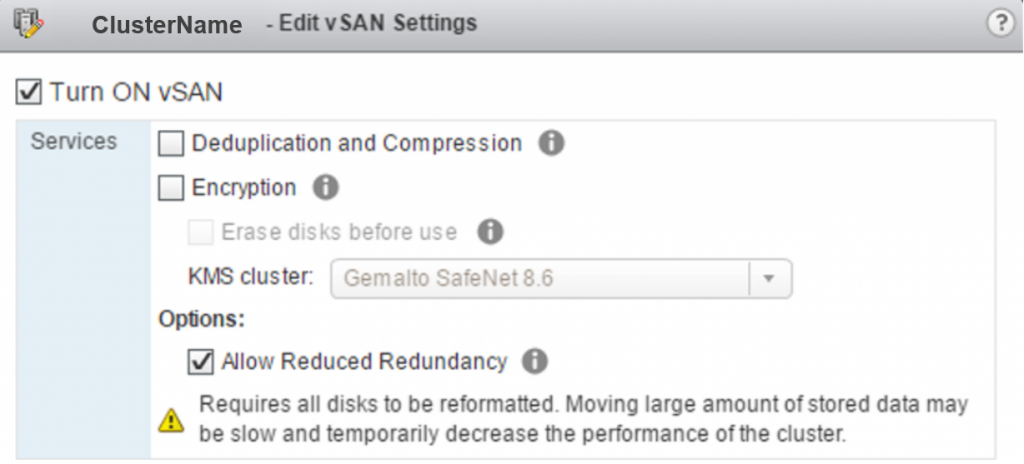
As user with “Administrator – No Cryptography” if you try to disable encryption on vSAN they do not receive the option due to a lack of privileges
Disable vSAN Encryption
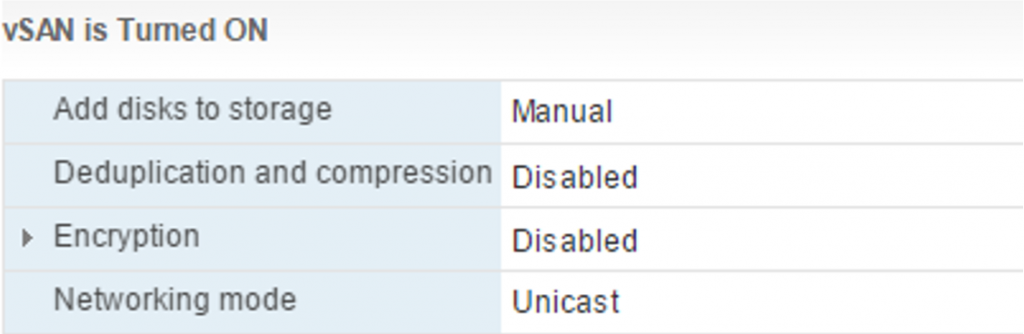
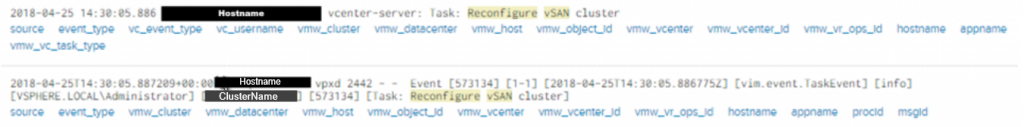
In this test, vSAN encryption was disabled. This is considered a reconfiguration of vSAN and logged accordingly.
Default vCenter logs show that vSAN is
being reconfigured:
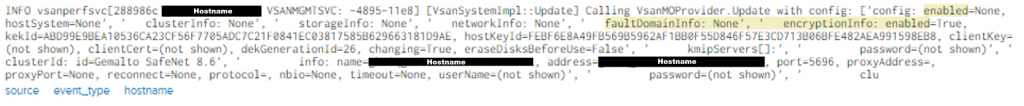
ESXi Host logs show that on the string [VsanSystemImpl::Update] the vSAN is being reconfigured and has encryption set to ‘enabled=true’.
Adding a KMS Server
The event of adding an additional KMS is logged, specifying the KMS alias name and the KMS Cluster into which it is added.
<datetime> <vCenterHostname> vpxd <eventID> - - <date> info vpxd[<Rand>] [Originator@xxxx sub=CryptoManager opID-KmipServerPageMediator-add-xxxxx-ngc:<rand>] A new Kmip Server <KMSName> is registered in cluster <KMSCluster>
The string “A new Kmip Server” can be used to alert on a new KMS server being added to the KMS Cluster.
Delete a KMS Server
The KMS Server was unregistered from the
VMware vCenter.
The following event described the removal.
<datetime> <vCenterHostname> vpxd <eventID> - - <date> info vpxd[<Rand>] [Originator@xxxx sub=CryptoManager opID-KmipServerActionResolver-remove-xxxxx-ngc:<rand>] Kmip Server <KMSName> is removed from cluster <KMSCluster>
vMotion
vMotion a VM from vSAN Datastore to Local Storage
The Test Virtual Machine (permbound1) was migrated from vSAN ‘vSANDatastore’ to local storage named ‘ds-local-ESXiHostnameLocalDS’
The following events were recorded by the default vCenter logs.
vcenter-server: Migrating <VMname> from <ESXiHostname>, <datastoreName> to <ESXiHostname>, <datastoreName> in <vCenterDatacenter>
The event is in the format and notes the time, who carried out the migration under the field “vc_username”, what was migrated, and the source/destination hosts and datastores.
As part of a client’s environment, there was a requirement from the end customer to forward additional logging information above the default logs forwarded by vCenter Server and Platform Services Controller (PSC).
In order to provide these additional logs
configuration of rSyslog is required to specify these files.
This post is intended to provide steps to implement these changes.
Additional logging available from non default vCenter logs
Single Sign-On Activities
Successful SSO Login
Successful SSO Logout
Successful SSO Active Directory Login
Successful SSO Active Directory Logout
Failed SSO Login
Failed SSO Login (User not found)
Failed SSO Active Directory Login
Failed SSO Active Directory Login (User not found)
SSO User Creation
SSO User Password Change
SSO User Deletion
SSO Group Creation
SSO Group Assignment
SSO Group Deletion
SSO Password policy update
vCenter Server Activities
Successful vCenter Server Login
Successful vCenter Server Logout
vSphere Permission Created
vSphere Permission Updated
vSphere Permission Deleted
vSphere Role Creation
vSphere Role Update
vSphere Role Deletion
In order to capture the above activities, you will need to forward the following log files:
/var/log/vmware/sso/vmware-sts-idmd.log
/var/log/vmware/sso/ssoAdminServer.log
/var/log/vmware/vpxd-svcs/vpxd-svcs.log
/var/log/vmware/vpx/vpxd.log
NOTE: I am not including the vpxd.log in my implementation below as it is an extremely verbose log and we did not require it for the security events we wished to capture. Additionally I don’t want someone blindly copying the config below without understanding it and accidentally upsetting their environment.
Implementation Steps
VMware Appliance Management Interface (VAMI)
Step 1 – Connect to the VAMI interface
for all vCenters and PSCs on HTTPS with port 5480
https://<appliancename>:5480
Step 2 – Configure Syslog with the
following settings.
Common Log Level
Info
Remote Syslog Host
<vRLI-LoadBalancer-VIP>
Remote Syslog Port
6514
Remote Syslog Protocol
TLS
vCenter Server Appliance
Step 1 – SSH to the VCSA and open the following file /etc/rsyslog.conf for editing.
vi /etc/rsyslog.conf
Step 2 – Press [Insert] to put vi into insert mode and add following entry towards the top of the file at the bottom of the ###### Module declarations ###### section.
$ModLoad imfile
Step 3 – Add the following right below the “###### Rule declarations
######” section of the rsyslog configuration file
$InputFileName specifies the log file that we want to forward.
$InputFileTag is the appname that will show up when it is forwarded to your remote syslog server
$InputFileStateFile is the log monitoring file.
$InputFilePollInterval is set 20 seconds, the default is 10 if you leave it blank.
Step 4 – Save your changes by pressing [Esc] and typing and pressing enter:
:wq
Step 5 – Restart the rsyslog service in the VCSA for the changes to go into effect by running the following command:
systemctl restart rsyslog
Platform Services Controller Appliance
Step 1 – SSH to the PSC and open the following file /etc/rsyslog.conf for editing.
vi /etc/rsyslog.conf
Step 2 – Press [Insert] to put vi into insert mode and add following entry towards the top of the file at the bottom of the ###### Module declarations ###### section.
$ModLoad imfile
Step 3 – Add the following right below the “###### Rule declarations ######” section of the rsyslog configuration file