I have just discovered this bug care of the tens of thousands of flapping alerts I’ve received in the last month.
Checking my federated vROps cluster to compile a report on the number of alerts generated over December I was greeted with a significantly higher number than I was expecting, especially considering the Christmas Change Freeze which would stop any non urgent tasks. Further investigation showed that it was due to a few dozen alert definition appearing thousands of times each (>6k alerts for one alert type on one cluster for example)
This appears to affect any alert based on receiving a fault symptom, such as all the default vSAN Management Pack Alerts for example.
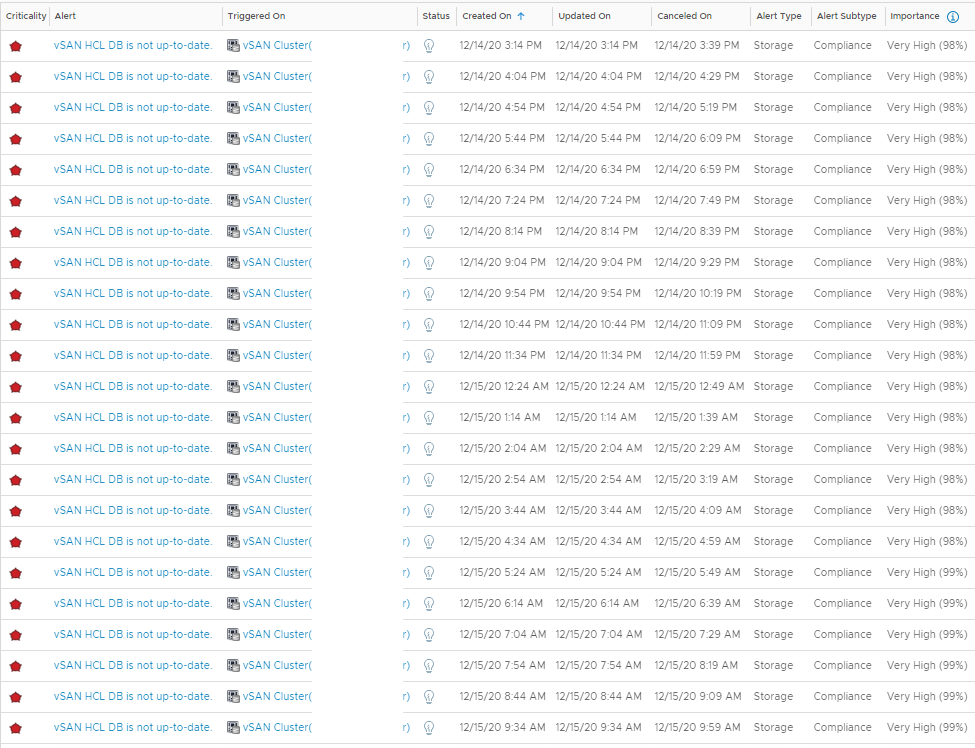
This manifests itself as an alert going active, and then soon after cancelling, and then reactivating aka flapping. See below for an example for one cluster where the HCL DB wasn’t up to date.
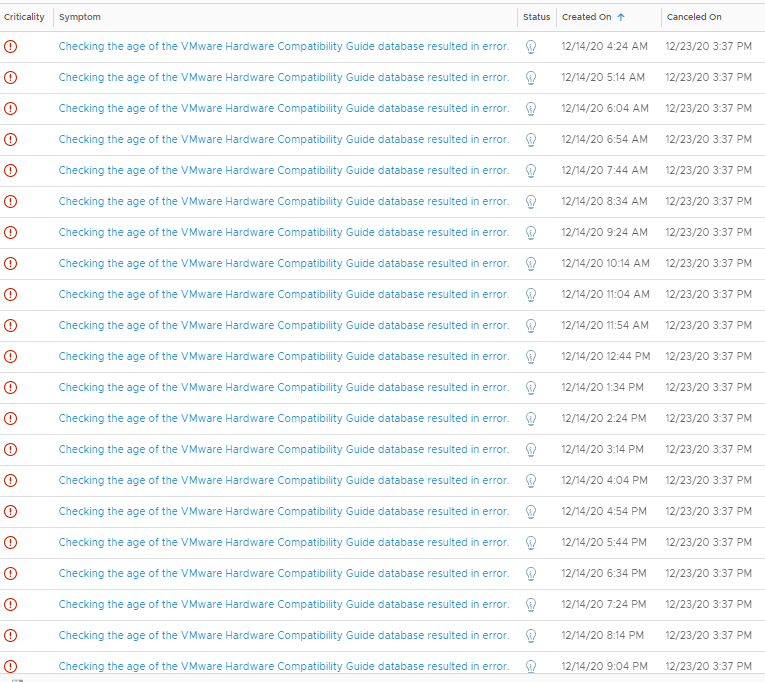
And the cause of this bug is seen in the symptoms view on the object where it creates a new symptom every time instead of updating the existing fault symptom.
If you look at the “cancelled on” value, they were all showing active at the same time, and cancelled when the vSAN HCL DB was updated around 3:30pm on the 23th December. The 50 minute regularity seems to tie in with the vSAN Health Check interval on the vCenter.
I am running vROps 8.1.1 (16522874), but not sure whether this impacts all versions of vROps 8.x but if you see this on any other versions, let me know.
Luckily there is a fix, HF4 which will take you to vROps version 8.1.1 (17258327)
As this pak file is 2.2GB in size, I am unable to host it on my blog for easy download, so I suggest you speak to your VMware TAM, Account Manager, or open a case with Global Support Services and reference this hotfix.
If all else fails I might be able to share it with you using onedrive, however I cannot promise a quick turnaround for that.
UPDATE: I have had it confirmed that this bug affects 8.0 and 8.2 as well, and there are hotfixes for those versions too. The next full release will have the fix built in.
If you are currently on 8.0.x or 8.1.x I would suggest either applying the HF and then upgrading straight to 8.3 when it is released or upgrading to 8.2 first and then applying the HF.
One of the first steps when troubleshooting vROps is to ensure that the correct ports are open.
This is best done via SSH, so first of all, enable that via the admin screen and log in as root (you did set a root password didn’t you? If not go do that now via the vSphere Console)
Port Checking
echo -e "\e[4;1;37mNode Connectivity Check..\e[0m"; for port in {80,123,443,6061} {10000..10010} {20000..20010}; do (echo >/dev/tcp/OTHERNODE_IPADDRESS/$port) > /dev/null 2>&1 && echo -e "\e[1;32mport $port connectivity test successful\e[0m" || echo -e "\e[1;31mport $port connectivity test failure\e[0m";done
copy and paste the above, changing the endpoint IP Address, to get a nice simple output for the usual ports required between the nodes.
When planning performing rightsizing events on a customer’s estate I am usually requested to estimate the number of new VMs which could be placed into estate on the resources freed up by rightsizing.
This can be calculated relatively easily by hand, but who wants to do that when you can have something else do it for you, and even utilise it on a dashboard as a KPI
My customer in this example have a guideline they use for an average machine on their estate which is 4 vCPU and 32GB RAM.
So in the first example I will show the code with a fixed VM size.
This calculation uses the floor function to take the lowest of an array of numbers. More details here:
The calculations it’s using here are the number of excess vCPU metric, divided by 4 vCPU for our guideline VM, and the amount of excess memory metric, convert from KB to GB and divided by 32GB RAM
Remember the depth setting allowing this supermetric to run at a higher grouping level such as vCenter or Custom Group
Now this can be further expanded by instead of using a fixed VM size, we could take the average VM size of the grouping we are running this supermetric against.
To do this we would replace the “4” and “32” with a calculation for average size
Today I’m going to talk about using vRealize Operations and Supermetrics to size your requirements for migrating from one estate to another.
I have a customer with a large sprawling legacy vSphere estate and they are planning their migration to a new VCF deployment using HCX.
They could simply keep everything the same size and purchase the appropriate number of nodes, however in this case that could become very expensive very quickly.
Luckily we have been monitoring the legacy estate with vROps 7.0 and 8.1 for the last year.
With this in mind I created a supermetric which would calculated the total number of hosts required if all the VMs were conservatively rightsized, which would reduce their resource allocation by up to 50%, based on the vROps analystics calculations for recommended size along with removing any idle VMs which are no longer required.
This supermetric works to a depth of 5 deep, which means that we can get a required number of hosts for a cluster level as well as a whole vCenter or even a custom group of multiple vCenters.
In my example my new hosts have 40 cores which we are allowing to over-allocate by up to 4:1 giving a maximum of 160 vCPU per host, along with 1.5TB of RAM which is not going to be over allocated.
This first calculation takes the total memory allocated on a cluster, removes the memory reclaimable from deleting idle VMs, and removes the total of memory able to be reclaimed by rightsizing the VMs.
This number is then divided by the amount of memory available in each host in kB
This number is then rounded up by using the CEIL function. More details on that here:
Similar to the memory calculation above, this takes the total number of vCPUs allocated on a cluster, removes the vCPUs able to be reclaimed from deleting idle VMs, and removes the total number of vCPUs able to be reclaimed by rightsizing the VMs.
This number is then divided by the number of cores available in each host multiplied by our maximum over-allocation of 4:1
Again this is rounded up using a CEIL function and then an additional host added for HA.
Step Three – Wrapping it up with a MAX function
This is the final super metric formula, which take the two calculations above and puts them into an array with the max function used to take the highest value to ensure we get the correct number of hosts.
This function has the following format:
max( [ calc1 , calc2 , … calcN ] )
You may spot that I have added a “3” as the third number, this is to ensure that the super metric never recommends a cluster size of less than three hosts.
Have you ever just wanted an IF Function when creating Super Metrics? Good news, there is one!
Leading on from the last post I did on determining the number of VMs which will fit into cluster, I have decided to further expand it with an IF function to take the Host Admission Policy failure to tolerate level into account as well.
Previously we used a flat 20% overhead as that was the company policy, however that reserved way too many resources on larger clusters, and setting it to a flat two host failures
We wanted to set any Cluster Compute Resource with less than 10 hosts, to only allow for a single host failure, but clusters of 10 and above should allow for two host failures.
In vROps terms this requires a Ternary Expression, or as most people know them, an IF Function.
You can use the ternary operator in an expression to run conditional expressions in the same way you would an IF Function.
I have a client using vROps 7 quite extensively, however they were still running a manual API Query to create a report on how many VMs of a certain size they could fit into their estate based on Allocation, which of course has been removed in 6.7 and 7.0. Running API Queries across their whole estate is a slow process, so they are interested in using vROps to estimate remaining VM overhead on a cluster.
Luckily this can be solved with a Super Metric.
First we need to calculate how many vCPU are available in total in the cluster, which is determined by the total number of cores multiplied by the overallocation ratio (4:1 here) and removing a buffer, in this case we are using 20% (80% remaining), but this can be set as the core count of one host if you prefer.
Then we remove the number of vCPUs that have been allocated to all the VMs.
Finally we divide by the number of vCPUs our template VM has. Two in this case.
Next we need to determine the available RAM in total in the cluster, which is determined by the total RAM minus a buffer, again this can be equivalent to one host if prefered.
We then need to remove the RAM allocated to all the VMs.
Next we need to then divide this value by 1048576 to convert from KB to GB
And then we divide by the number of GB of RAM our VM has. We are using 4GB here.
For our last calculation, we need to determine the Storage by taking the total storage capacity, removing our buffer and removing the total usage. You could also use the total allocated if you don’t want to over provision storage. If you are using vSAN you can add in the vSAN replica storage as well. 2x for RAID1, 1.33x for Erasure Coding FTT=1 (AKA RAID5) and 1.5x for Erasure Coding FTT=2 (AKA RAID6). We are using RAID5 in this example.
We then divide this by either the size of the VMDK HDD or an average utilisation depending on your policy. We are using 80GB here for calculation purposes.
Now we have our three calculations we need to use some advanced Super Metric functions to chose the calculation with the lowest number, as that will be the driving factor on what will fit in the cluster.
This is done with the function “MIN” and feeding in an array
min([FormulaA,FormulaB,FormulaC])
Now we have the minimum number of VMs which will fit, we need to round down that number, because nobody cares that 67.432 VMs could fit in the cluster, they want to know that 67 VMs will fit. Luckily there is another function for that – “FLOOR”. This is similar to ROUNDDOWN in that it give you the whole value.
floor(formula)
FYI “CEIL” is equivalent to ROUNDUP if you want the value to be rounded up.
Now we tie these all together to get our full calculation.
Now clone this to estimate remaining VM Overhead for each T-Shirt size you offer.
Update March 2020
I have further updated this super metric to use total provisioned for the storage when in use with vSAN or other thin provisioned datastores as well as also taking Swap size into account, and changed the overhead from a flat 20% to the equivalent of two hosts.
This section will take the total core count, and then remove the total core count divided by the number of hosts and multiply by the number of host failures to allow in a cluster (2 in this case), and then multiply by the vCPU to Core overallocation ratio (4:1 in this case).
For storage I have changed to using the metric “diskspace|total_provisioned” instead of “diskspace|total_used” and added the memory size on top of the HDD size (500GB HDD plus 32GB Swap)
I recently came across a client using vROps 7.5 with a fault with the vROps Summary tab for individual objects. It was working fine for some objects but not others.
The fault they were suffering with resulted in the Summary tab not working for certain object types. It would either show a blank grey screen or it would automatically forwarded to the “Manage Dashboard” screen. If you added “/alerts” to the end of the URL you can get to the alerts tab and then click and access all the other tabs.
Although if you then click on the vROps Summary tab, it just shows a blank screen or forwards to Manage Dashboards again.
At first I thought it had to be some Licensing “feature” to annoy people who were breaking their allowed number of Licensed Objects, so applied a temporary 10k OSI Enterprise license and STILL had the issue.
Even taking the cluster offline and rebooting, and reinstalling Management Packs didn’t fix the issue.
I was scratching my head for two days trying to figure out why it was only affecting some object types, but thanks to a nudge from a colleague we discovered the problem.
The Summary Dashboards Summary Detail tabs were blank for these object types but set correctly for others.
The vROps Summary Tab Fix!
This annoying fault can be resolved using these steps:
Navigating to Dashboards
Manage Dashboards
Click the Cog Icon
Manage Summary Dashboards
Select adapter type associated with your Object Types ( vCenter Adapter in my case)
Click on each of the items with blank ‘Detail Page’ entries
Click the ‘Use Default’ button in the top left hand corner to re-add them to summary detail
Save
Now go run and find a Virtual Machine and revel in the glow of a working Summary tab in details view.
I’ve not found this discussed anywhere else, so hopefully this will be useful for anyone else who has this issue.
I recently came across a problem at a client’s with integrating Log Insight (vRLI) with vROps. The connection tests successfully and alert integration works, however launch in context returns the error “Registration failed: Log Insight Adapter Object Missing”
After a discussion with GSS it was discovered this is actually a known issue due to the vROps cluster being behind a load balancer and the following errors are shown in the Log Insight log /storage/var/loginsight/vcenter_operations.log
[2018-05-15 09:51:02.621+0000] ["https-jsse-nio-443-exec-3"/10.205.73.139 INFO] [com.vmware.loginsight.vcopssuite.VcopsSuiteApiRequest] [Open connection to URL https://vrops.domain.com/suite-api/api/versions/current]
[2018-05-15 09:51:02.621+0000] ["https-jsse-nio-443-exec-3"/10.205.73.139 INFO] [com.vmware.loginsight.vcopssuite.VcopsSuiteApiRequest] [http connection, setting request method 'GET' and content type 'application/json; charset=utf-8']
[2018-05-15 09:51:02.621+0000] ["https-jsse-nio-443-exec-3"/10.205.73.139 INFO] [com.vmware.loginsight.vcopssuite.VcopsSuiteApiRequest] [reading server response]
[2018-05-15 09:51:02.626+0000] ["https-jsse-nio-443-exec-3"/10.205.73.139 ERROR] [com.vmware.loginsight.vcopssuite.VcopsSuiteApiRequest] [failed to post resource to vRealize Operations Manager]
javax.net.ssl.SSLProtocolException: handshake alert:  unrecognized_name
This is caused by some security updates to the Apache Struts, JRE, kernel-default, and other libraries from vRealize Log Insight 4.5.1. These updated libraries affect the SSL Handshake that takes place when testing the vRealize Operations Manager integration.
To resolve this issue we needed to add the FQDN of the vROps load balancer as an alias to the apache2 config. This can be done by following these steps.
Log into the vRealize Operations Manager Master node as root via SSH or Console.
Open /usr/lib/vmware-vcopssuite/utilities/conf/vcops-apache.conf in a text editor.
Find the ServerName ${VCOPS_APACHE_SERVER_NAME} line and insert a new line after it.
On the new line enter the following:
ServerAlias vrops.domain.com
Note: Replace vrops.domain.com with the FQDN of vRealize Operations Manager’s load balancer.
5. Save and close the file.
6. Restart the apache2 service:
service apache2 restart
7. Repeat steps 1-6 on all nodes in the vRealize Operations Manager cluster.
I was recently asked by a colleague new to vROps, on how to remove a management pack in their client’s environment and realised it’s not really well documented and used to be a GSS only process.
Unfortunately removing a management pack from vROps is a CLI operation.
1. Log in to the vRealize Operations Manager Master node as root through SSH or Console.
2. Run this command to determine the existing management pack .pak files and make note of the name of the solution you want to remove:
This post was written by Cameron Fore and is being reproduced here just for posterity purposes for a future implementation. Original link HERE
vROps for Horizon provides end-to-end visibility into key User session statistics that make it easy for Horizon admins to visualise and alert on performance problems impacting the user’s of their environment. One of the key metrics used in determining how well user’s are connected to their virtual app or desktop session is Session Latency (ms), as it most visually impacts the user’s perspective of their session performance. The lower the session latency, the quicker video, keyboard, and mouse inputs are redirected to and from a user’s endpoint client, giving the user a more native-like PC experience.
As the latency trends higher (>180ms), the experience begins to
degrade, and the user can begin to notice “sluggishness“ – slow keyboard,
mouse, and video responsiveness.
vROps for Horizon gives us direct visibility into when these issues are occurring across all of the Active User Sessions of the Horizon View environment. However, once the session becomes inactive, it will go into a stale object state and be removed from vROps during a clean-up window.
To be able to view this information historically on Pools and User
objects, you can create Super Metrics that simply maps the session latency to
the objects you want to report on.
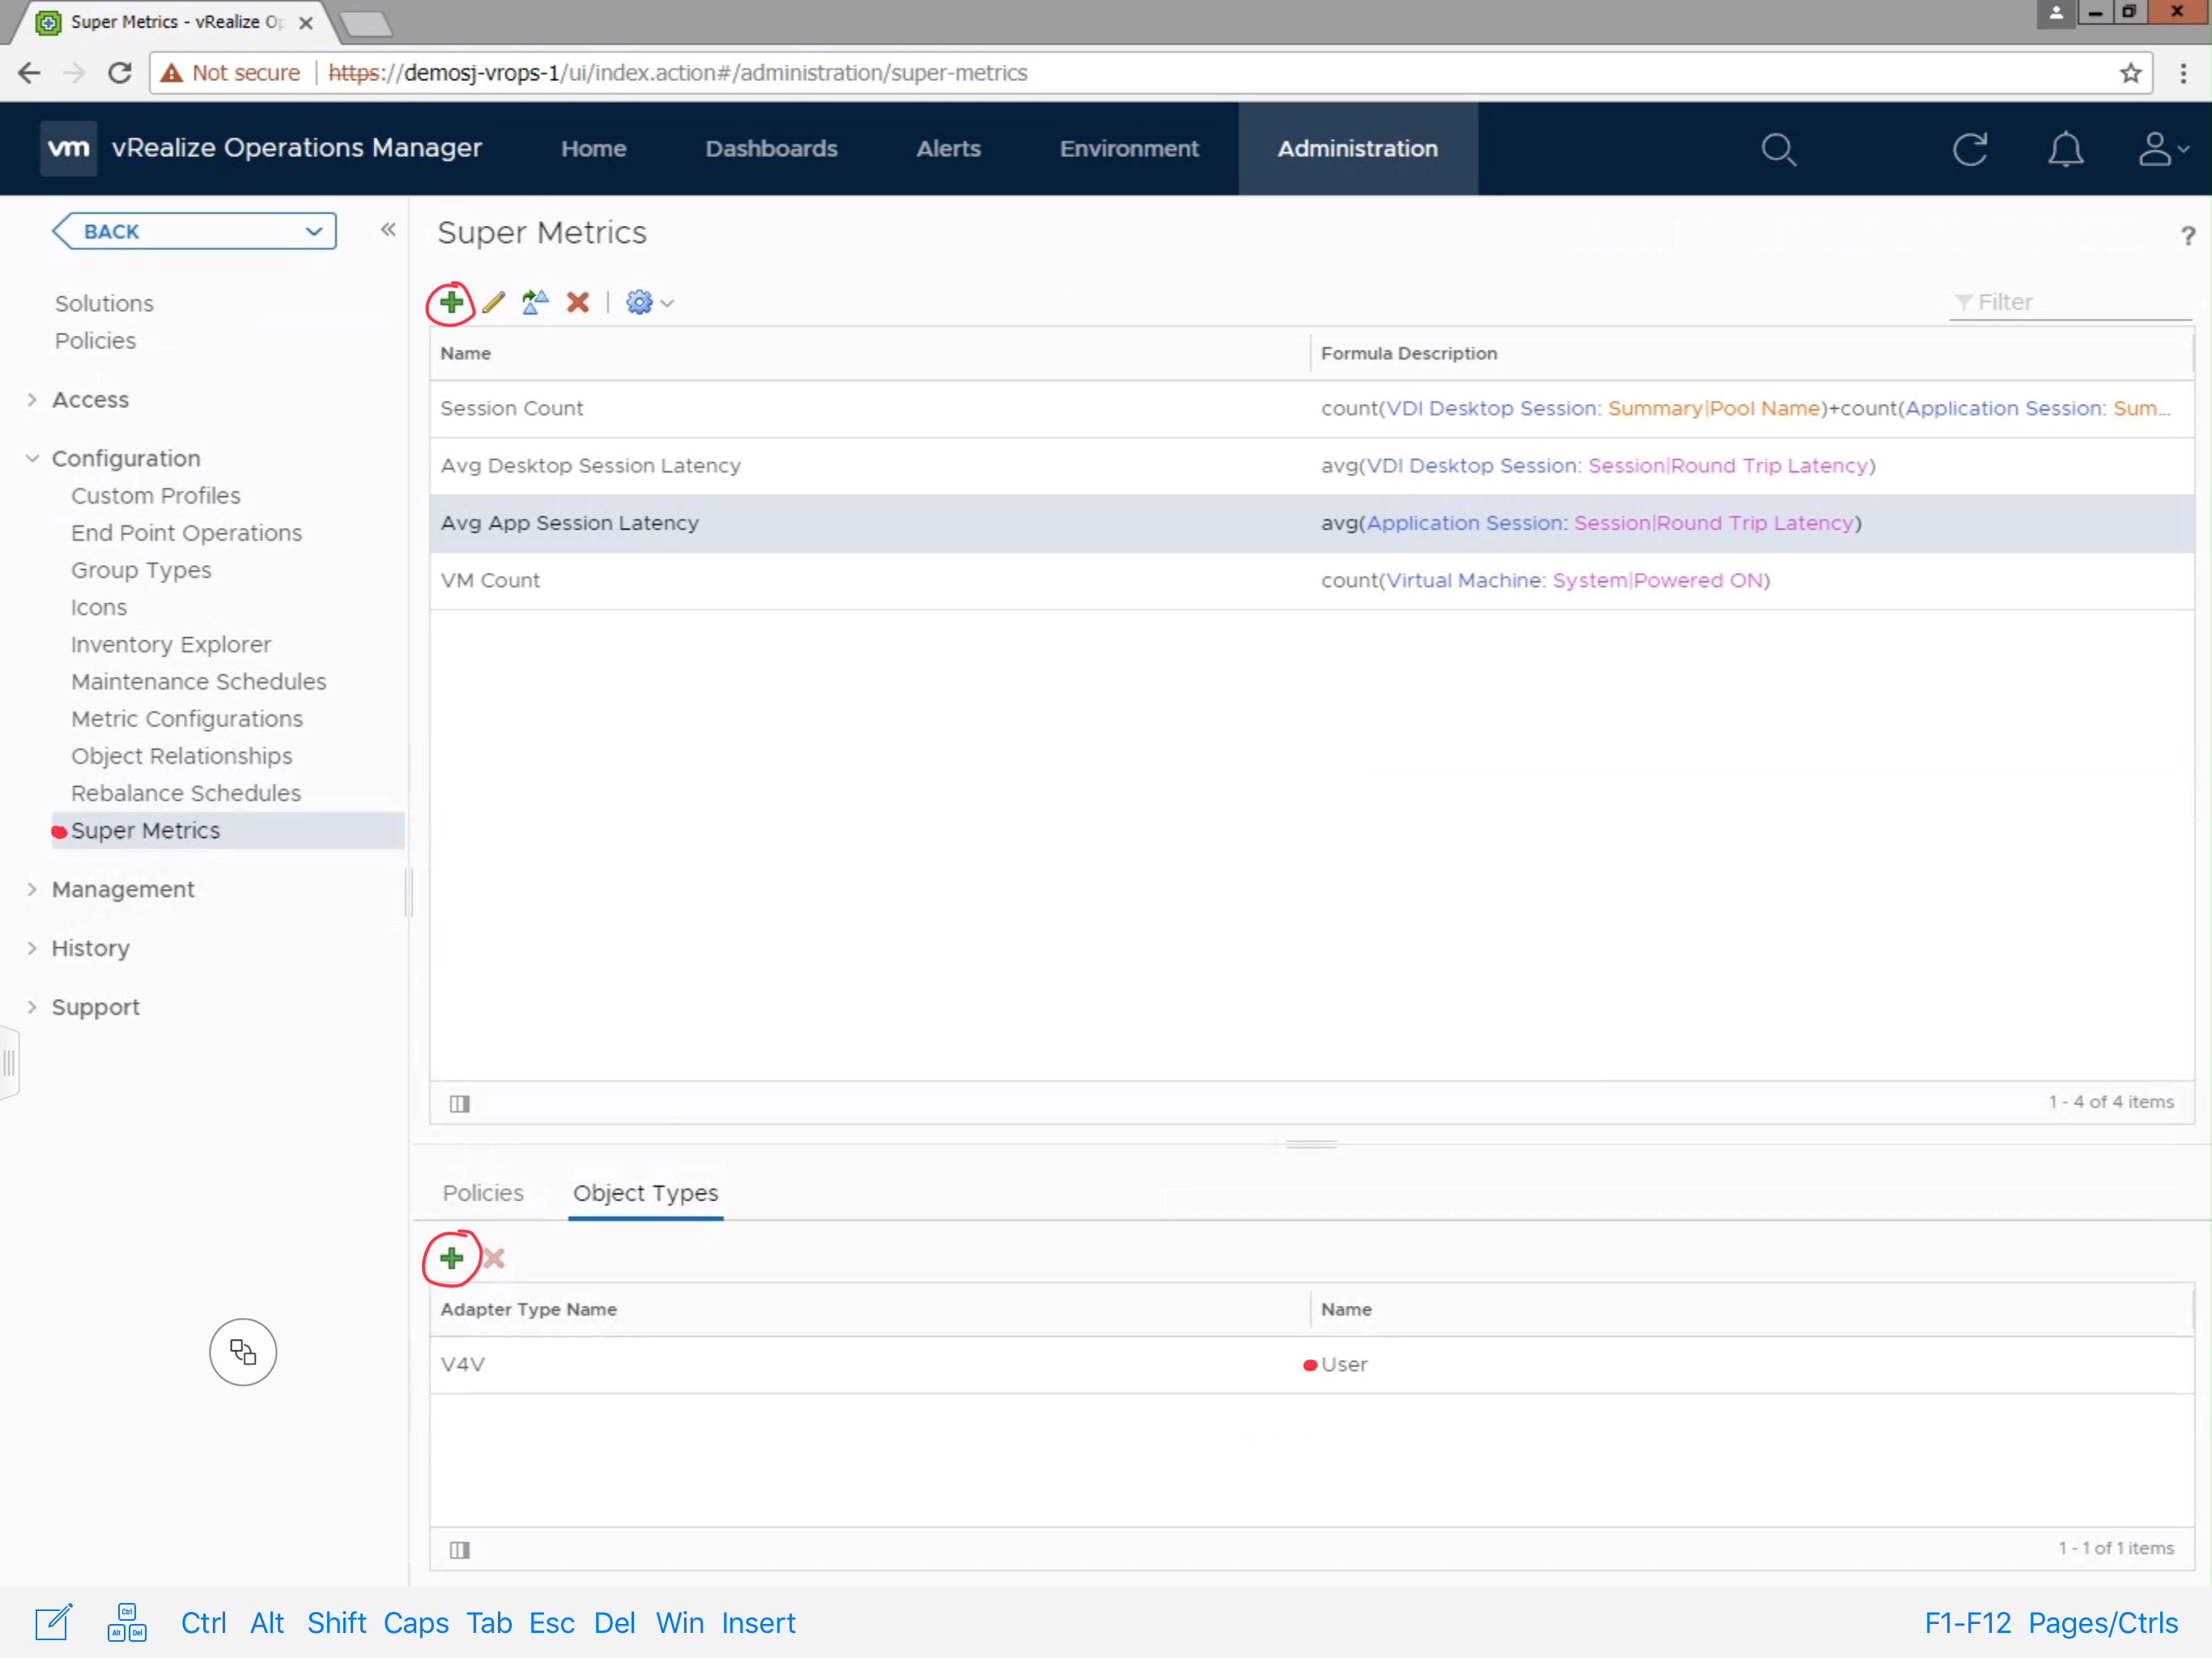
Creating the Super Metric
To create the Super Metric, Navigate to Administration ->
Configuration -> Super Metrics. Click the green + sign to create a new
Super Metric.
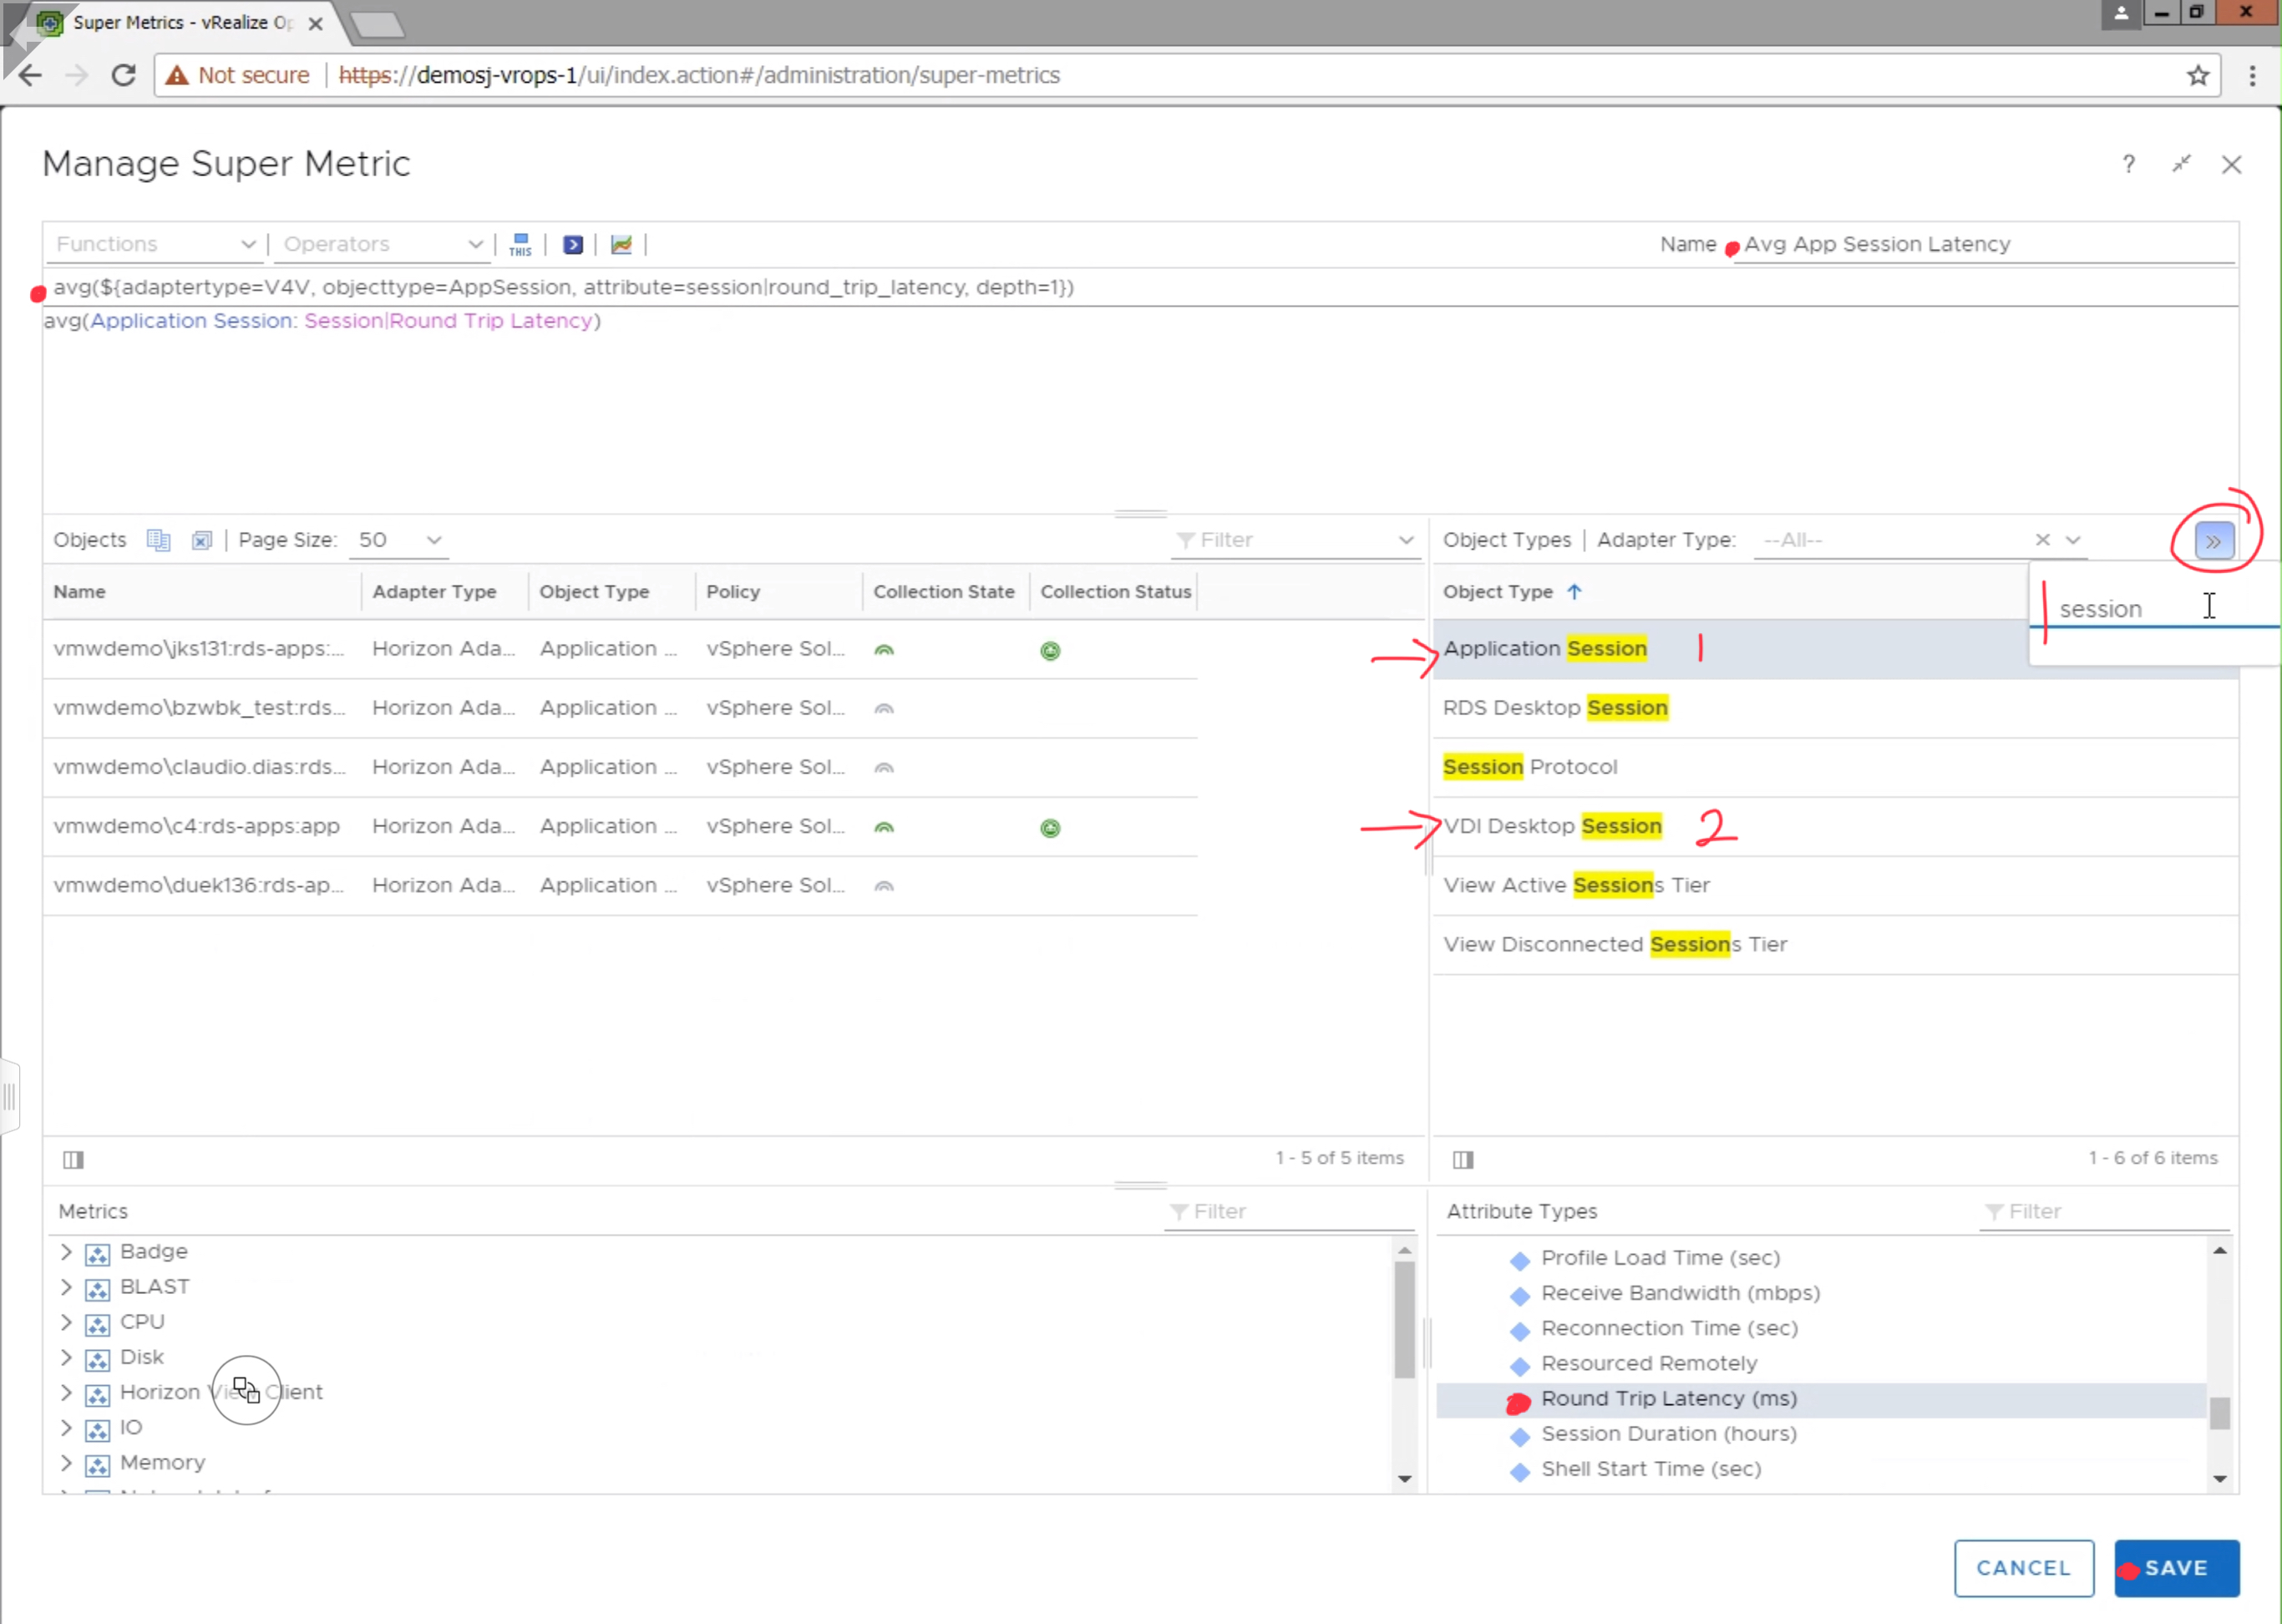
Provide the Super Metric a unique name, in this case we are using “Avg
App Session Latency”. Search for the “Application Session” Object
Type, and click “Round Trip Latency (ms)” to add it to the Super Metric.
Since, we are looking for the average latency, select “avg” from the
available functions list, making sure that the average function applies to the
metric by encapsulating it parenthesis as demonstrated in the image below.
Click Save to finish the Super Metric.
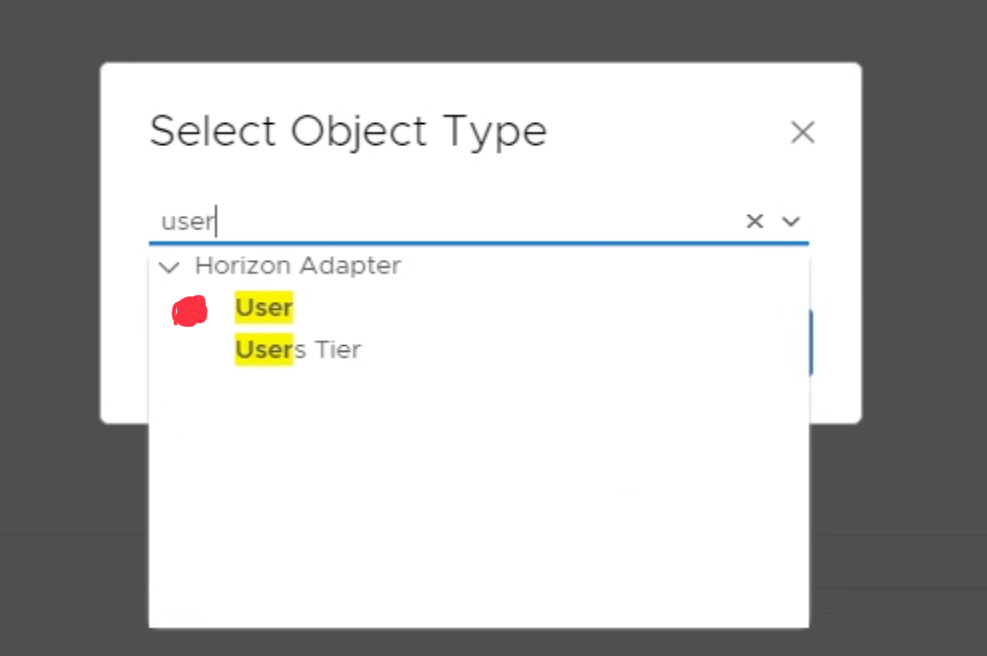
Next, you will need to add the Super Metric to the “User” object type.
Click the green + sign under the “Object Types” section. Search and
select the “User” object type.
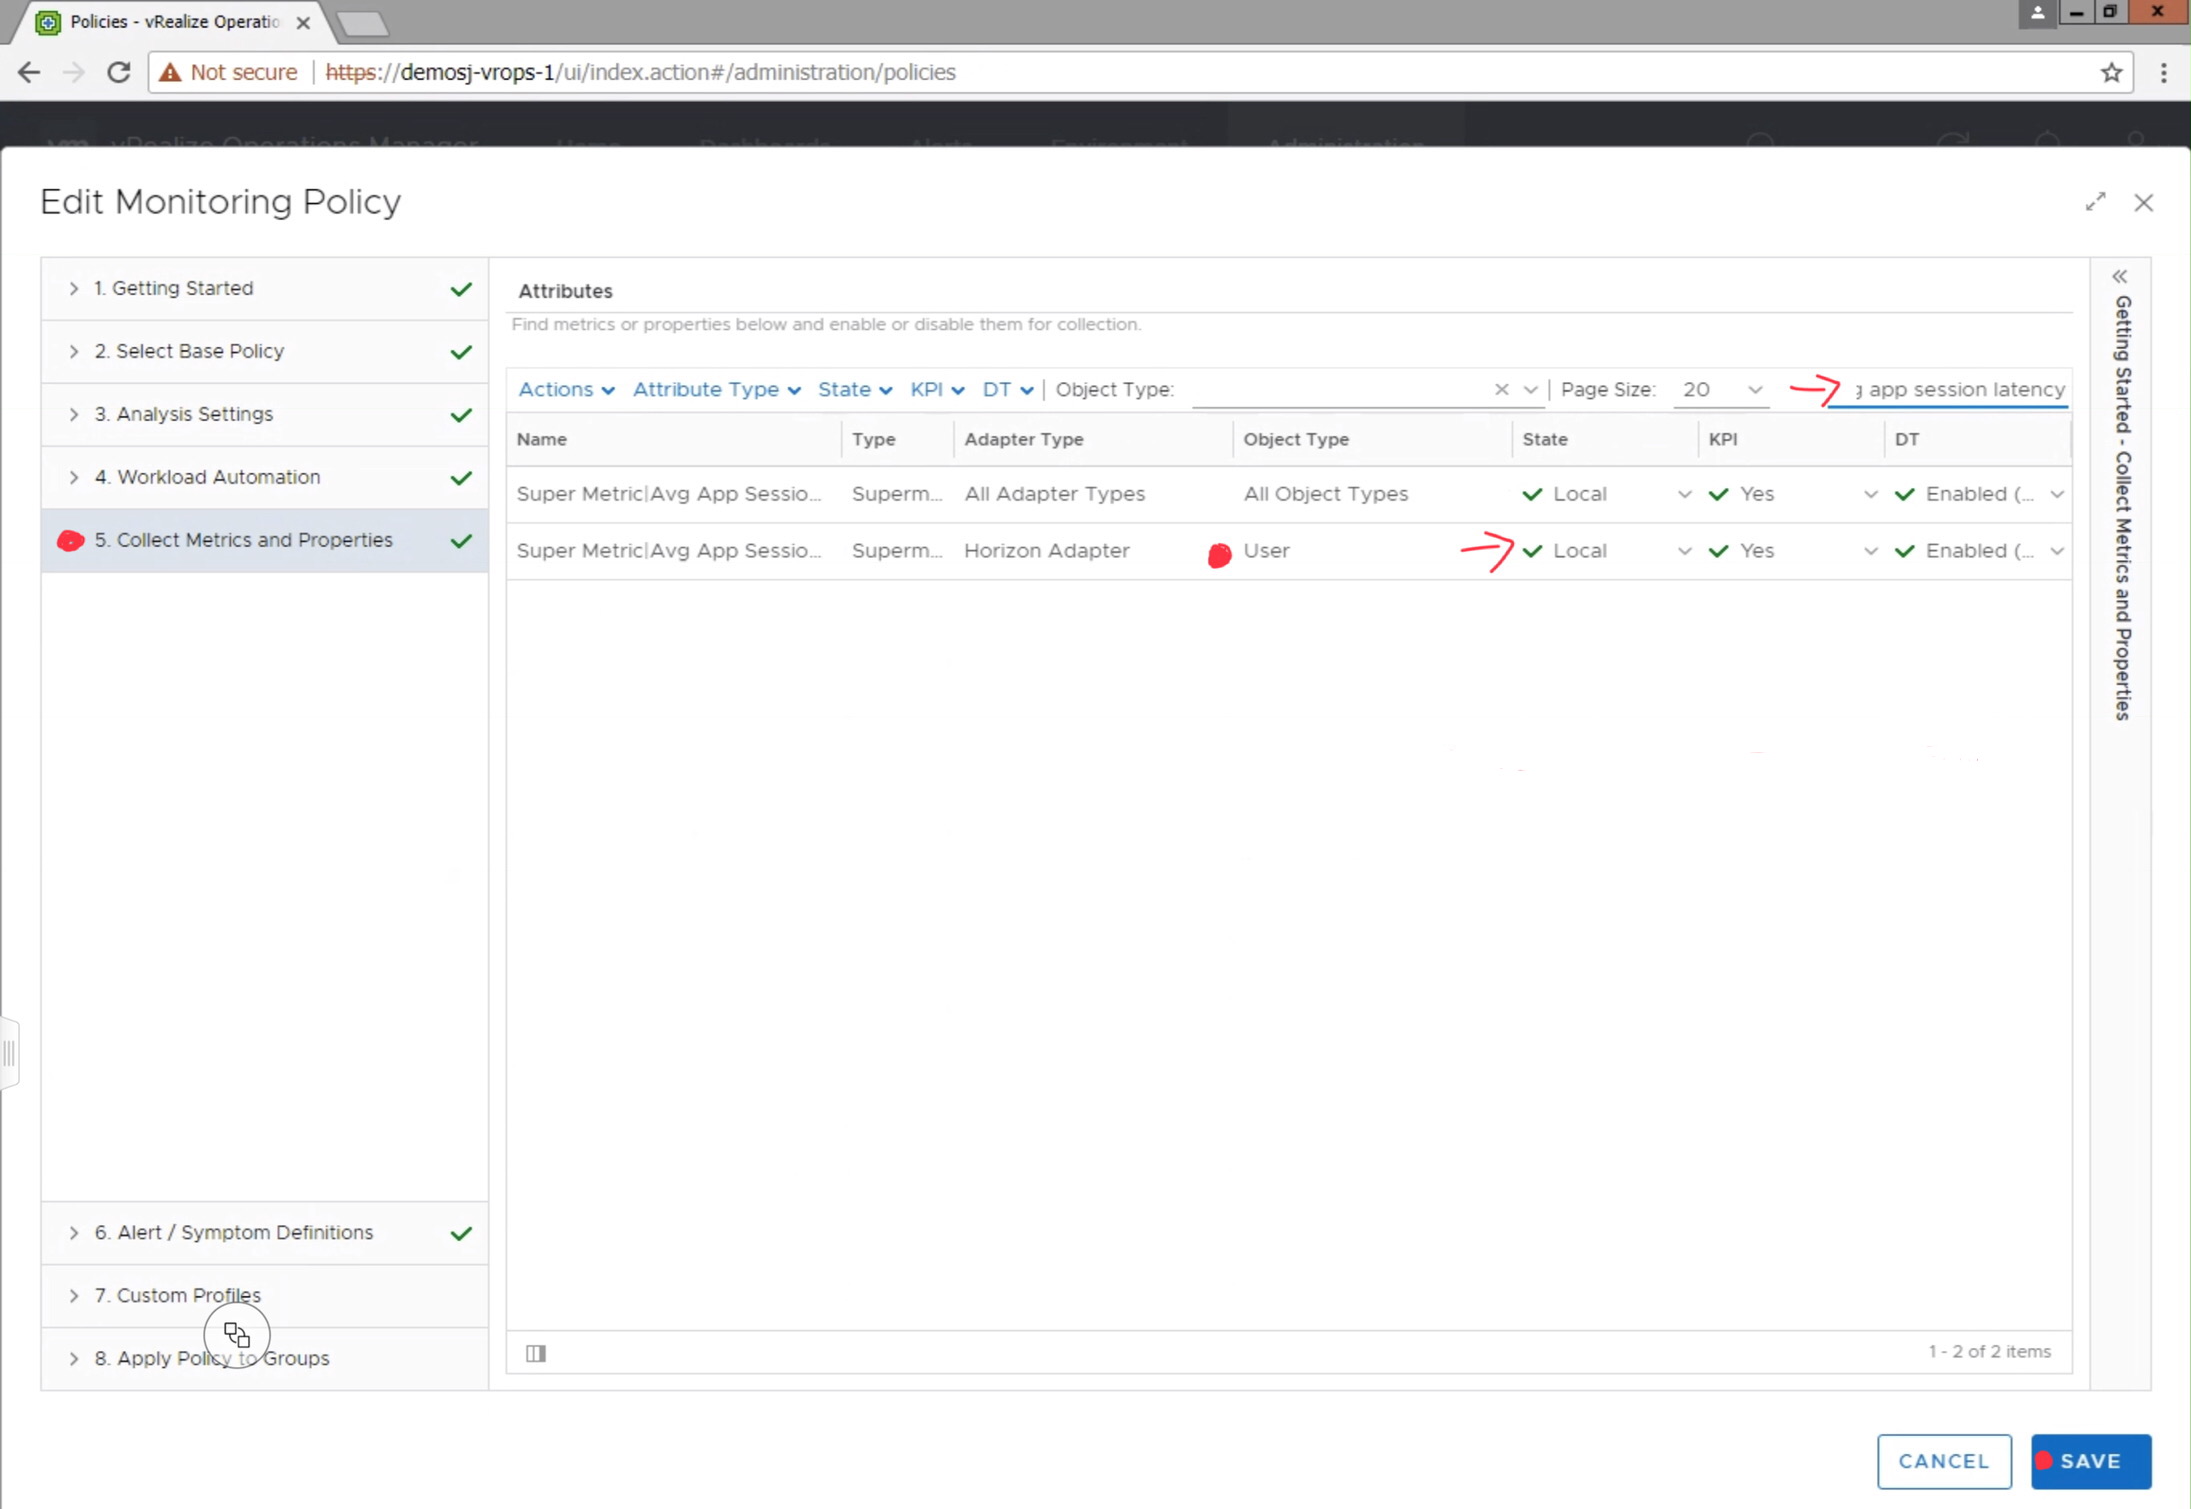
Before the Super Metric will begin collecting data, you will need to
navigate to Administration-> Policies, and edit the active monitoring policy
to enable the metric for collection.
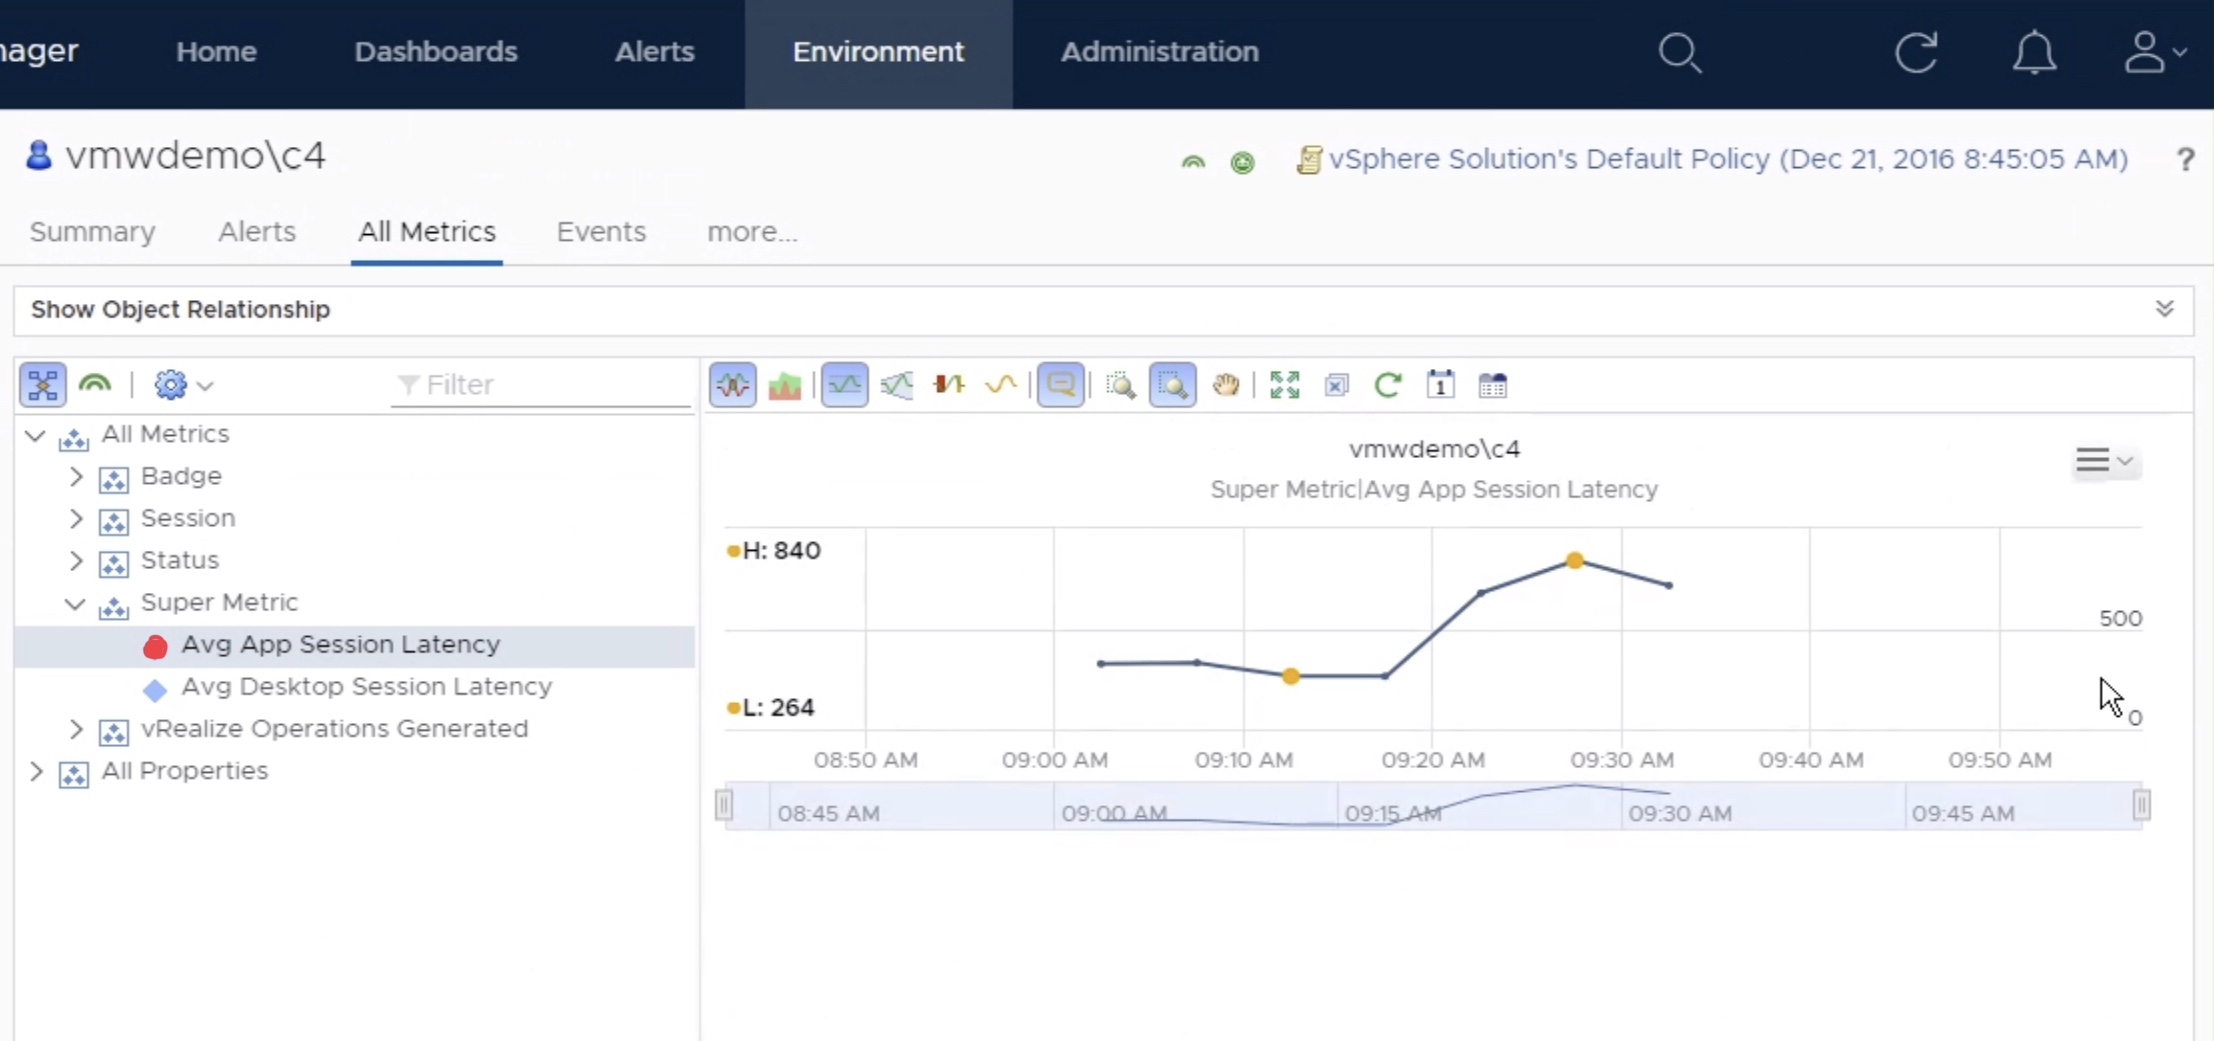
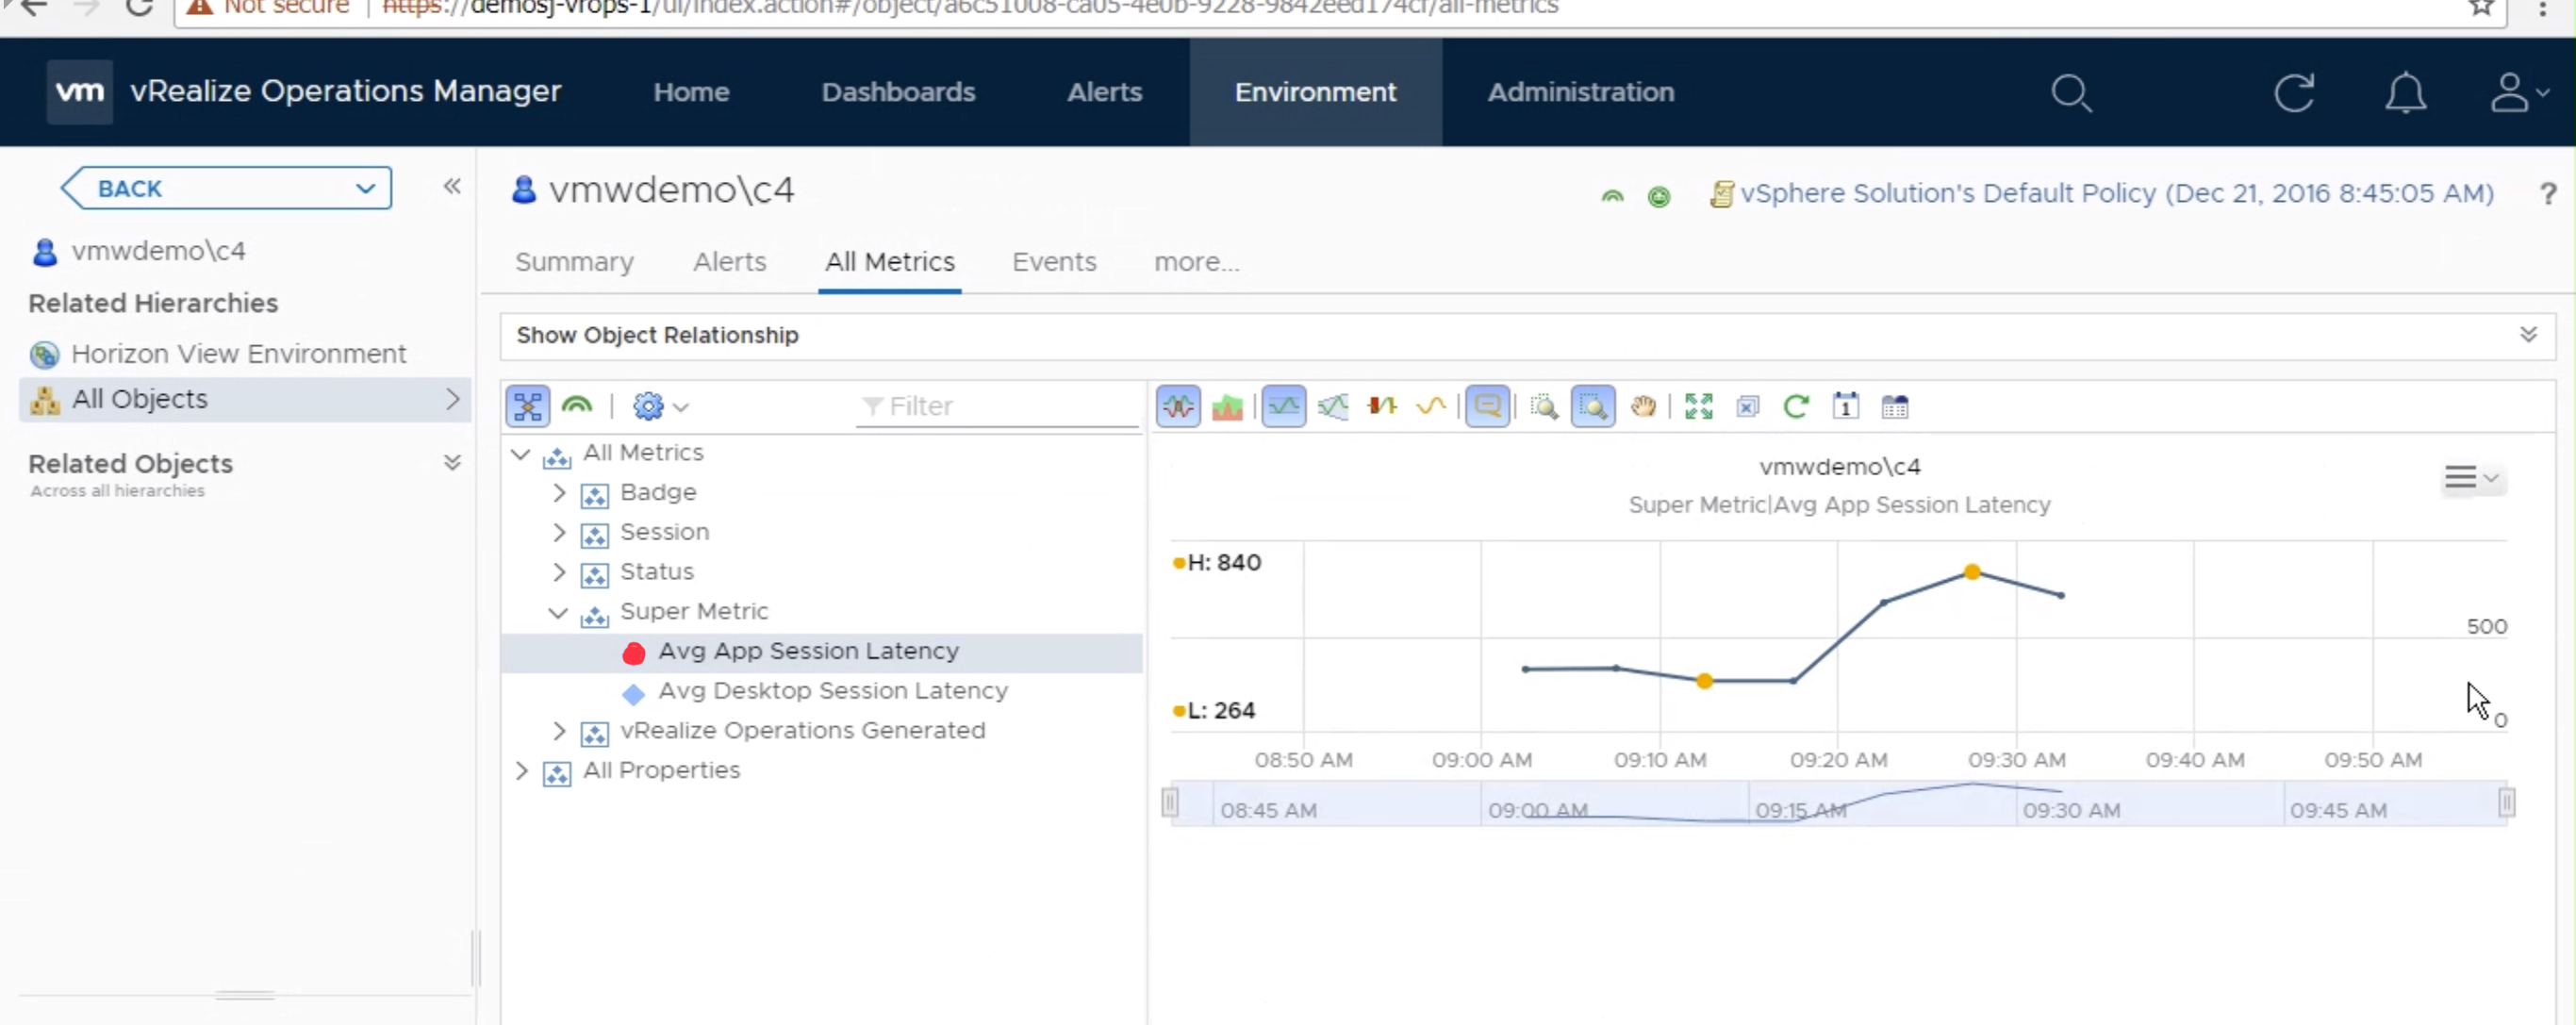
Once the metric has started to collect data, you can view the data on a
individual “User” object by selecting “All Metrics” -> Super Metric ->
select metric.
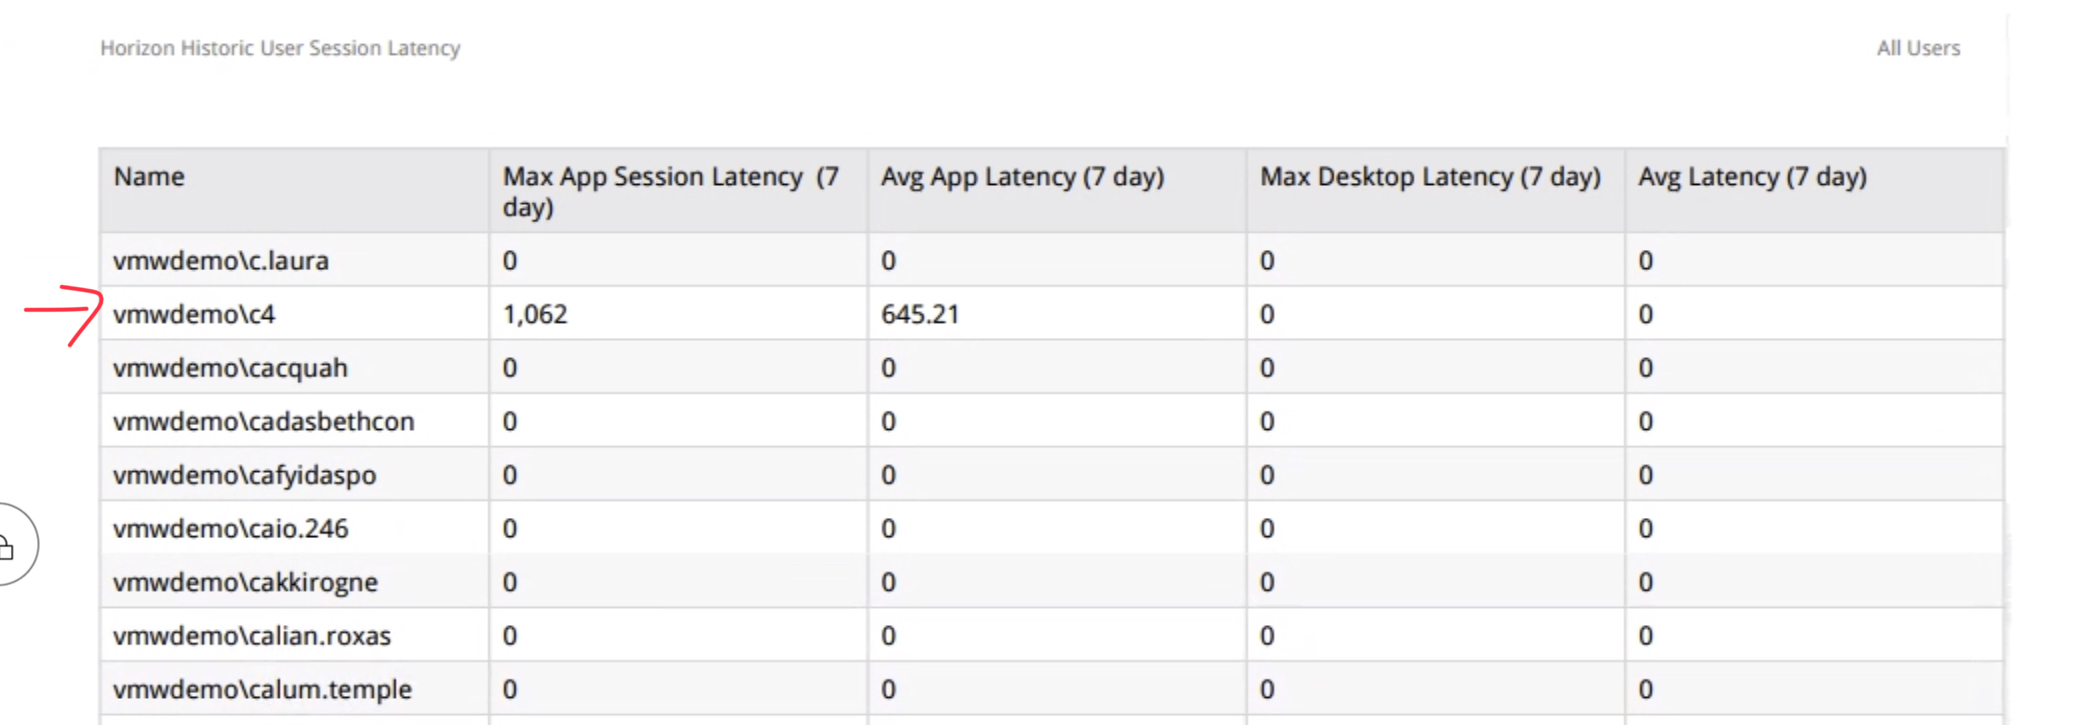
You can also create custom Views that display the historical latency for all users of the environment, as well as perform simple roll-up statistics.
I had a customer with a very large legacy estate of very large VMs with RDMs attached, both physical and virtual. We were implementing vRealize Operations (vROps) and the customer wished for a way to automatically categorise and discover all VMs which had an RDM attached to them in the vROps dashboards and reports.
There are many ways to attempt to do this but it was decided that the simplest was to create a PowerCLI script to add a vCenter Custom Attribute to all VMs with an RDM attached. This Custom Attribute will automatically show as a property in vROps against the VM object, allowing for a new Custom Group to be created for VMs with and without RDMs. As vROps custom groups can be set for dynamic membership, the groups can be kept up to date without further configuration within vROps.
This script is designed to be run on a regular basis in order to account for new machines being added.
#load VMware PowerCLI module
if ((Get-PSSnapin | where {$_.Name -ilike "VMware.VimAutomation.Core"}).Name -ine "VMware.VimAutomation.Core"){
	Write-Host "Loading VMware PowerCLI"
	Add-PSSnapin VMware.VimAutomation.Core -ErrorAction SilentlyContinue
}

#Disconnect from any active vCenter sessions
If ($global:DefaultVIServers) {
    Disconnect-VIServer -Server $global:DefaultVIServers -Confirm:$false -Force:$true
    }

#define variables
$VMwithRDM=@()

#Retrieve Local Hostname
$LocalvCenter=[System.Net.Dns]::GetHostByName((hostname)).HostName

#Connect to servers

Write-Host "Connecting to Local vCenter"
Connect-VIServer $LocalvCenter

try {
	#Check if CustomAttributes Exist, if not create them
	if ((Get-CustomAttribute -Name 'RDMAttached' -TargetType VirtualMachine -ErrorAction:SilentlyContinue) -eq $null){
			Write-Host "Creating Custom Attribute RDMAttached"
			New-CustomAttribute -Name "RDMAttached" -TargetType VirtualMachine
	}


	#Write Annotations for VMs with RDMs Attached
	Write-Host "Writing Annotations" -NoNewline

	$VMwithRDM = Get-VM | Where-Object {$_ | Get-HardDisk -DiskType "RawPhysical","RawVirtual"}


	foreach($vm in $VMwithRDM){
		#Write annotations
		$vm|Set-Annotation -CustomAttribute "RDMAttached" -Value "True"
		Write-Host "." -NoNewline
	}#end Write Annotation
	Write-Host "`n"


} #end of try

Catch {
	Write-Host $_.Exception.Message -ForegroundColor Red
}

Finally{
	Write-Host "Disconnecting from vCenter"
	Disconnect-VIServer -Confirm:$false -Force:$true
}